TL;DR
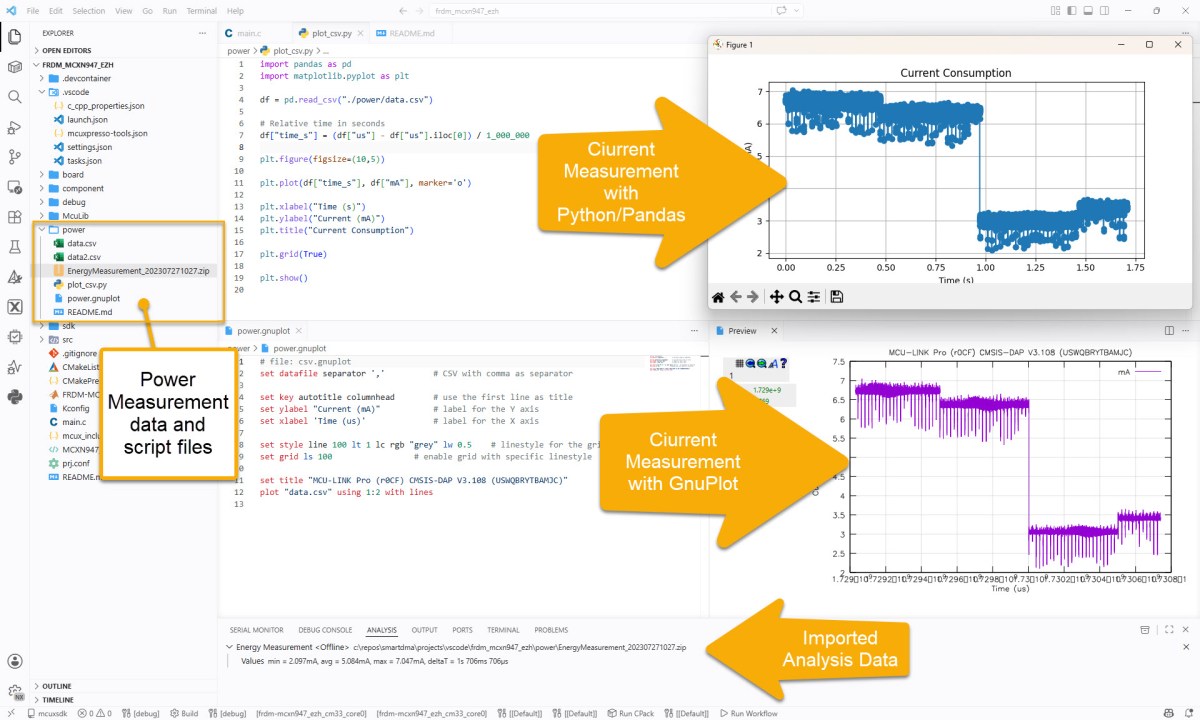
The article discusses a method for visualizing current and power data from the NXP MCU-Link Pro using Visual Studio Code (VS Code). It focuses on leveraging Python libraries, specifically Pandas for data manipulation and GnuPlot for graphing, to analyze energy consumption in embedded systems.
Why This Was Curated
The article provides practical guidance for software developers on visualizing embedded power data using familiar tools like VS Code and Python, making it highly relevant and actionable. It effectively bridges the gap between software and hardware by focusing on a specific application, though it could benefit from more in-depth project examples.